When a data model diagram contains cycles it’s ambiguous, because more than one path exists from the same two tables. When I began writing DAX code I thought that in case more than one path connected the same two tables, the result was the intersection of the filters. I was wrong.
A few days ago I answerd a question on stackoverflow.com about what happens when USERELATIONSHIP is used with an ambiguous model and I realized that the proposed model was the simplest case of ambiguity: three tables and three relationships.
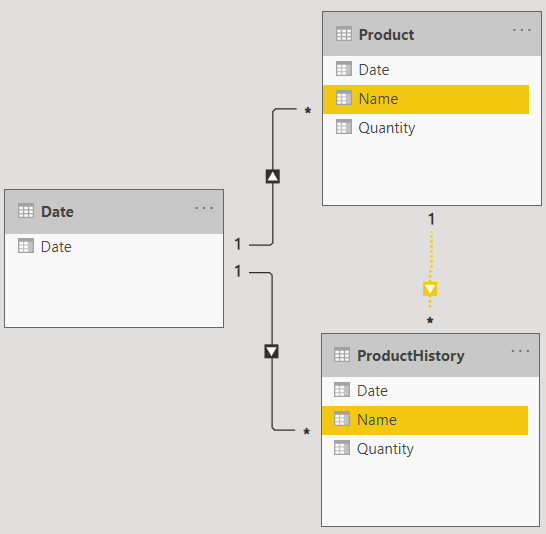
There are two relationships on the Date column and an inactive one on the Name column between Product and ProductHistory. The last relationship is inactive, because otherwise it would create an ambiguity on the propagation of a filter from ‘Date'[Date] to ProductHistory[Date]. What would be the right path to follow? From Date directly to ProductHistory or from Date to Product and then to ProductHistory?
With the Product[Name] –> ProductHistory[Name] relationship inactivated, it’s evident that a filter applied to ‘Date'[Date] directly propagates to ProductHistory without crossing the Product table.
This can be seen by executing this query in DAX Studio, that per each ‘Date'[Date] shows the corresponding ProductHistory rows, according to the active relationship:
EVALUATE
GENERATE(
    ALL( 'Date'[Date] ),
    CALCULATETABLE(
        ProductHistory
    )
)
The result shows matching dates, as expected, since the ‘Date'[Date] –> ProductHistory[Date] relationship is the active one

But what happens when activating the Product[Name] –> ProductHistory[Name] relationship with USERELATIONSHIP ?
- Both relationship are used and the result is the intersection
- Only the relationship specified with USERELATIONSHIP is used and the other one is ignored
The answer is the latter: DAX uses only the path containing the relationship specified with USERELATIONSHIP and ignores any other existing path. The result is that the ‘Date'[Date] -> ‘ProductHistory'[Date] relationship becomes the inactive one for the duration of the CALCULATETABLE where USERELATIONSHIP is applied.
This can be seen by executing this other query in DAX Studio
EVALUATE
GENERATE(
    ALL( 'Date'[Date] ),
    CALCULATETABLE(
        ProductHistory,
        USERELATIONSHIP ( 'Product'[Name], ProductHistory[Name] )
    )
)
The result shows that the dates don’t match between ‘Date'[Date] and ProductHistory[Date].

‘Date'[Date] matches with the Product[Date], as can be seen in the code used to generate the three tables:
Product =
DATATABLE(
    "Name", STRING, "Date", DATETIME, "Quantity", INTEGER,
    {
        { "A", "2020-01-01", 1 },
        { "B", "2020-01-01", 2 }
    }
)

ProductHistory =
DATATABLE(
    "Name", STRING, "Date", DATETIME, "Quantity", INTEGER,
    {
        { "A", "2020-01-02", 10 },
        { "A", "2020-01-03", 20 },
        { "B", "2020-01-01", 30 }
    }
)

Date = CALENDAR( "2020-01-01", "2020-01-31" )
The sample files for this article can be found on my github