In my previous post I implemented the snapshot table for the Events in progress DAX Pattern using DAX. A possible alternative is to build the snapshot table in Power Query using the M language.
Trying to push further my HR head count model to include the years up to 2015 on my not-so-powerful PC I quickly reached an out of memory error

Therefore I decided to Implement the snapshot table using the M language in Power Query.
This M code is equivalent to the DAX one in my previous post. It takes a few minutes to build the same snapshot table for the 2008-2010 dates interval of the previous post.
let
    LastLeaveDate = #date( 2010, 12, 31 ),
    Source = Employee,
    #"Added Custom" = Table.AddColumn(Source, "Date", each List.Dates(
    [HireDate],
    Duration.Days(
        (
            if [LeaveDate] is null
            then LastLeaveDate
            else [LeaveDate]
        ) - [HireDate]
    ) + 1,
    #duration( 1, 0, 0, 0 )
)),
    #"Expanded Date" = Table.ExpandListColumn(#"Added Custom", "Date"),
    #"Removed Columns" = Table.RemoveColumns(#"Expanded Date",{"Name", "HireDate", "LeaveDate"}),
    #"Changed Type" = Table.TransformColumnTypes(#"Removed Columns",{{"Date", type date}})
in
    #"Changed Type"
I decided to keep it simple, therefore I didn’t implement the code to determine the LastLeaveDate, but I used an inline constant instead.
Then, changing the LastLeaveDate I was able to load the 2008-2015 snapshot table, that failed with the DAX implementation.
Finally I changed the SQL source DB to StackOverflow2013 (available thanks to Brent Ozar blog), that has a 2.5 Million rows user table. Using this configuration I was able to load a 1.6 Billion rows snapshot table, using my old PC, in about one hour and a half.

The final model size is 2,69 GB and performance of [Head Count Snapshot EOP] measure is still very good.
Implementing the snapshot table using Power Query
As a first step I deleted the Employee Snapshot calculated table in the model and I opened the Transform Data window.
To speed up the refresh time during the development I changed the Source SQL query of the Employee table, to make it load just 100 rows. Clicking on the small gear next to the Source step

I added “TOP 100” to the query after the SELECT

using the context menu over the Employee query in the Queries left panel I added a reference to the Employee query as the first step to the new Employee Snapshot query


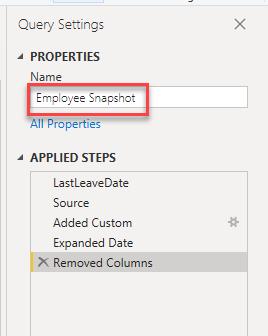
Then in the Query settings panel I renamed the new query to Employee Snapshot
At this point we have the same data as the Employee query. We need to add a column containing the list of dates included in the interval between the HireDate and the LeaveDate.
To do so I added a custom column from the Add Column ribbon

Then I added the M code to generate the list of dates, using the M function List.Dates()
List.Dates(start as date, count as number, step as duration) as listthis function takes the start date as first argument, the number of elements of the list to be generated, of type number, and the interval between each two elements, of type duration.
In our scenario the number of elements is the number of days and the step is one day.
The number of elements can be obtained as the difference between the LeaveDate and the HireDate, adding one since both dates must be included. But the difference between two dates returns a duration, therefore I had to use the Duration.Days() function to convert the duration to a number.
The duration can be directly specified using the #duration() function
#duration(days as number, hours as number, minutes as number, seconds as number) as durationTo handle the null LeaveDates I had to use the if then else construct and the #date() function to build the date to be used instead of null
#date(year as number, month as number, day as number) as datePutting this all together I wrote this custom column formula
= List.Dates(
    [HireDate],
    Duration.Days(
        (
            if [LeaveDate] is null
            then #date( 2010, 12, 31 )
            else [LeaveDate]
        ) - [HireDate]
    ) + 1,
    #duration( 1, 0, 0, 0 )
)
And named the custom column to be created “Date”

At this point we have a table with the same number of rows as the Employee table, and the same columns plus the new Date columns containing a list. Now we must expand the list in the last column to obtain a table with one row per each day in the list. This can be done using the “Expand to new rows” menu directly on the top of the Date column


Now we can get rid of the Name, HireDate and LeaveDate columns, that are not needed in the snapshot table.

And finally we must convert the type of the Date column from Any to Date

Clicking on Close & Apply, I had to wait a few minutes for the snapshot table generation.

After testing that everything was still working as with the DAX generated snapshot table, I decided to move the #date constant to a variable declared before the step that creates the custom column, so I used the Advanced Editor to open the full M query

and I added the line to declare the LastLeaveDate variable to be used instead of the #date() for the #”Added Custom” step
LastLeaveDate = #date( 2010, 12, 31 ),
The 1.6 Billion Rows model
The data used by this big model to simulate the employees are taken from the StackOverflow2013 Users table, that contains the user accounts created on StackOverflow from 2008 to 2013. Therefore the HireDate are simulated from 2008 up to 2013 and LeaveDate from 2008 to 2015.
This means that the head count grows up to the end of 2013 and then just decreases.

The changes from the previous model, the one using StackOverflow2010 DB were just four
First, the Database was changed to StackOverflow2013

Second, the SQL statement in the previous window was changed to force the LeaveDate to NULL after the year 2015
WITH CTE AS (
SELECT [AccountId]
      ,[DisplayName]
      ,CONVERT(DATE, [CreationDate]) AS HireDate
      ,CONVERT(DATE, [LastAccessDate]) AS LeaveDate
  FROM [dbo].[Users]
  WHERE Id <> -1 AND Id <> 11
)
SELECT
	 AccountId AS ID
	,DisplayName AS Name
	,HireDate
	,CASE WHEN LeaveDate > '20151231' THEN NULL ELSE LeaveDate END AS LeaveDate
FROM CTE
Third, the LastLeaveDate in the M code was changed to 2015-12-31
let
    LastLeaveDate = #date( 2015, 12, 31 ),
    Source = Employee,
    #"Added Custom" = Table.AddColumn(Source, "Date", each List.Dates(
    [HireDate],
    Duration.Days(
        (
            if [LeaveDate] is null
            then LastLeaveDate
            else [LeaveDate]
        ) - [HireDate]
    ) + 1,
    #duration( 1, 0, 0, 0 )
)),
    #"Expanded Date" = Table.ExpandListColumn(#"Added Custom", "Date"),
    #"Removed Columns" = Table.RemoveColumns(#"Expanded Date",{"Name", "HireDate", "LeaveDate"}),
    #"Changed Type" = Table.TransformColumnTypes(#"Removed Columns",{{"Date", type date}})
in
    #"Changed Type"
Finally the Date calculated table was expanded to include dates up to the end of 2015
Date =
ADDCOLUMNS(
    CALENDAR(DATE(2008, 1, 1), DATE(2015,12,31)),
    "Year", YEAR( [Date] ),
    "Year Month", EOMONTH([Date], 0), -- formatted as yyyy-mm
    "Month", MONTH( [Date] )
)
And that’s it. After applying the changes and waited for about 1 hour and a half for the snapshot to be loaded (old PC), I removed the graph using the [Head Count Snapshot ALL] at the day granularity level, that took a long time before failing with an error.
The final pbix takes about 135MB of disk space.
Model Size and Performance
The size of the model as shown by the Vertipaq Analyzer Metrics Summary panel of DAX Studio is 2.69 GB

2.6GB that, as expected, are mainly allocated to the Employee Snapshot table.

To measure performance of the new model I ran the same DAX queries of the previous post using the DAX Studio Server Timings panel.
At first the measure that does not use the snapshot table at the day granularity level, that took 282 seconds
DEFINE
    MEASURE Employee[Head Count] =
        VAR FromDate =
            MIN ( 'Date'[Date] )
        VAR ToDate =
            MAX ( 'Date'[Date] )
        RETURN
            CALCULATE (
                COUNTROWS ( Employee ),
                Employee[HireDate] <= ToDate,
                Employee[LeaveDate] >= FromDate
                    || ISBLANK ( Employee[LeaveDate] ),
                REMOVEFILTERS ( 'Date' )
            )
EVALUATE
SUMMARIZECOLUMNS (
    'Date'[Date],
    "Head_Count", 'Employee'[Head Count]
)
ORDER BY 'Date'[Date]
Then the [Head Count Snapshot ALL] measure, that uses DISTINCTCOUNT on the snapshot table, at the day granularity level. That went rather bad: after several minutes spent swapping memory to the disk it failed with an out of memory error message.
DEFINE
    MEASURE Employee[Head Count Snapshot ALL] =
        DISTINCTCOUNT ( 'Employee Snapshot'[ID] )
EVALUATE
SUMMARIZECOLUMNS (
    'Date'[Date],
    "Head_Count_Snapshot_ALL", 'Employee'[Head Count Snapshot ALL]
)
ORDER BY 'Date'[Date]

The End Of Period measure, that uses COUNTROWS on the snapshot table instead of DISTINCTCOUNT, ran in about 2 seconds.
DEFINE
    MEASURE Employee[Head Count Snapshot EOP] =
        CALCULATE (
            COUNTROWS ( 'Employee Snapshot' ),
            LASTDATE ( 'Date'[Date] )
        )
EVALUATE
SUMMARIZECOLUMNS (
    'Date'[Date],
    "Head_Count_Snapshot_EOP", 'Employee'[Head Count Snapshot EOP]
)
ORDER BY 'Date'[Date]
The [Head Count] measure at the month level ran in about 7 seconds
DEFINE
    MEASURE Employee[Head Count] =
        VAR FromDate =
            MIN ( 'Date'[Date] )
        VAR ToDate =
            MAX ( 'Date'[Date] )
        RETURN
            CALCULATE (
                COUNTROWS ( Employee ),
                Employee[HireDate] <= ToDate,
                Employee[LeaveDate] >= FromDate
                    || ISBLANK ( Employee[LeaveDate] ),
                REMOVEFILTERS ( 'Date' )
            )
EVALUATE
SUMMARIZECOLUMNS (
    'Date'[Year Month],
    "Head_Count", 'Employee'[Head Count]
)
ORDER BY 'Date'[Year Month]
The [Head Count Snapshot ALL] measure executed at the month level took 35 seconds
DEFINE
    MEASURE Employee[Head Count Snapshot ALL] =
        DISTINCTCOUNT ( 'Employee Snapshot'[ID] )
EVALUATE
SUMMARIZECOLUMNS (
    'Date'[Year Month],
    "Head_Count_Snapshot_ALL", 'Employee'[Head Count Snapshot ALL]
)
ORDER BY 'Date'[Year Month]
Finally, the [Head Count Snapshot EOP] at the month granularity level ran in 1.4 seconds.
DEFINE
    MEASURE Employee[Head Count Snapshot EOP] =
        CALCULATE (
            COUNTROWS ( 'Employee Snapshot' ),
            LASTDATE ( 'Date'[Date] )
        )
EVALUATE
SUMMARIZECOLUMNS (
    'Date'[Year Month],
    "Head_Count_Snapshot_EOP", 'Employee'[Head Count Snapshot EOP]
)
ORDER BY 'Date'[Year Month]
At the day level it’s always possible to use the EOP measure, therefore performance is rather good.
At the month level, when it’s possible to use the EOP measure performance is very good. But if the requirement is to consider the full time interval selection instead of just the last day, then the [Head Count] measure can be used, that at the month level is still acceptable.
The sample pbix file can be downloaded from my GitHub shared project.
The big model was too big to be shared, though. Therefore I just shared the pbit.
EDIT: the new article Loading Large Random Datasets with Power Query contains sample pbix of this big model with a random dataset that can be made large at will though a parameter

Could the big model be published to Power BI Service with Pro license or would it be too big in data size?
LikeLiked by 1 person
i was able to upload this model to my personal free account, the Settings->Mange personal storage page shows 133 MB dataset size
LikeLiked by 1 person