In the previous post I showed a simple Linear Regression measure that works on a four level Hierarchy: Year-Quarter-Month-Day. The code is rather long, and implementing the Linear Regression formula for several measures would require a lot of copy & paste.
Luckily there is a better alternative to copying and pasting code: that is to resort to Calculation Groups.
Using Tabular Editor on the sample pbix of my previous post I created a Calculation Group named “Trend Line”, with two Calculation Items: “Value” and “Trend”. Value returns the measure to which it is applied, without any further calculation. Trend instead computes the Linear Regression on the measure.
It’s now possible to create a line chart with the measure and the corresponding trend line by selecting the measure in the Values field and the “Trend Line” calculation group as the Legend

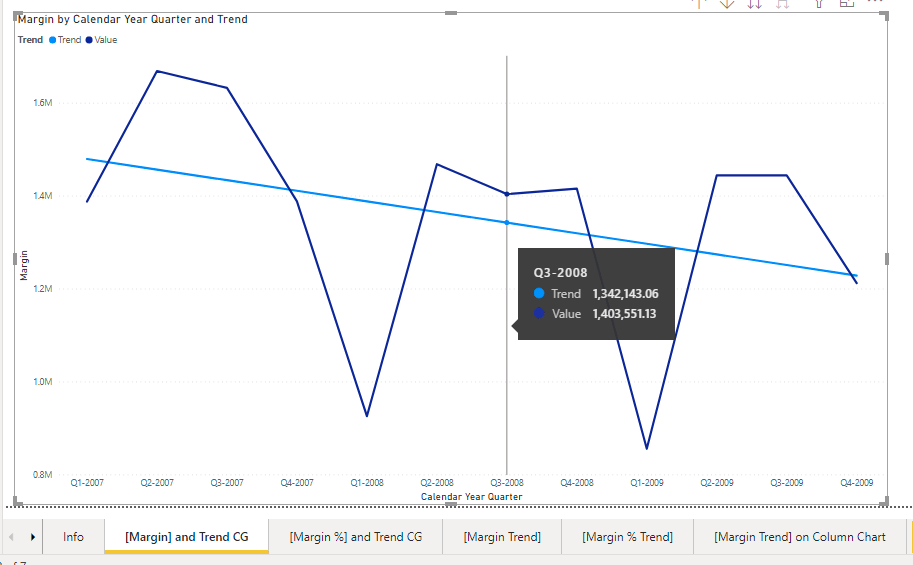
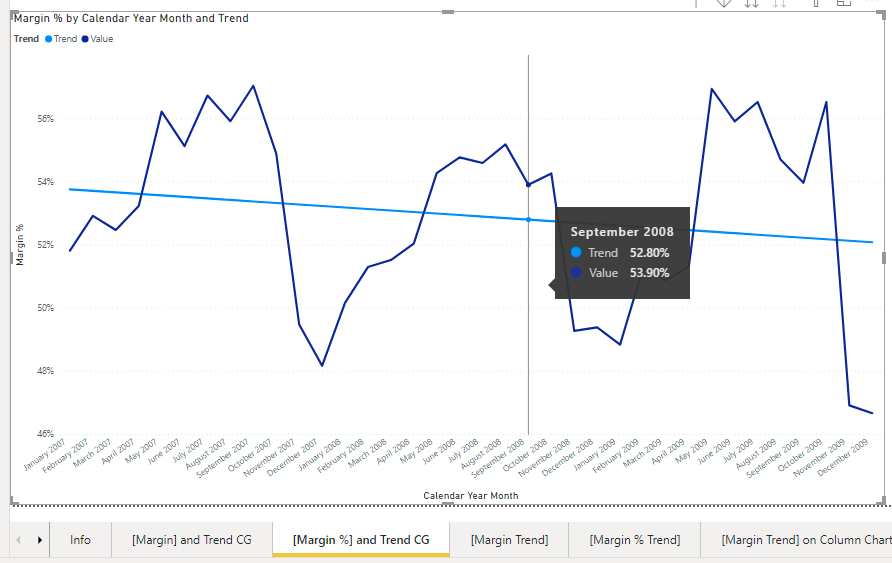
We can now use any measure we please, like for instance the [Margin %]

Now it’s also possible to declare new Trend Line measures without having to copy the full implementation by just applying the existing calculation groups with CALCULATE like
Margin Trend = CALCULATE ( [Margin], 'Trend Line'[Trend] = "Trend" )

and

Margin % Trend = CALCULATE ( [Margin %], 'Trend Line'[Trend] = "Trend" )
These two measures can be used as the Trend Line measure in the previous post. No calculation group is to be selected for the line chart, but just the [Margin] and the [Margin Trend] measures


And the same can be done using [Measure %] and [Measure % Trend] measures.


Conclusions
The calculation groups are an effective way to avoid code duplication.
The Trend Line Calculation Group implementation
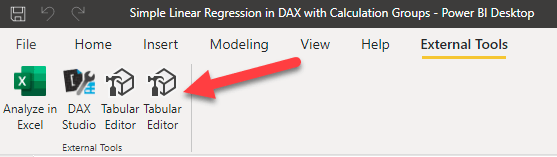
Calculation Group creation is not supported by the Power BI user interface, but an external tool is required. I used Tabular Editor 2, that is an open source project that can be found on github
As a first step I ran Tabular Editor from the External Tools ribbon in Power BI (I have two versions installed)
Then I selected “Create New -> Calculation Group” from the context menu on “Tables” in the “Model” tree view in Tabular Editor

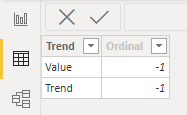
Then I renamed the column name “Name” to “Trend” and created two new Calculation Items: Value and Trend

Then, using the Expression Editor panel, I implemented the Value calculation item, so that it just returns the current measure using
SELECTEDMEASURE()
And for the Trend calculation item I copy/pasted (one last time) the Linear Regression DAX code for the [Margin] measure and I replaced any reference to the measure [Margin] with SELECTEDMEASURE()
IF (
    NOT ISBLANK ( SELECTEDMEASURE () ),
    SWITCH (
        TRUE,
        ISINSCOPE ( 'Date'[Date] ),
            VAR Tab =
                FILTER (
                    CALCULATETABLE (
                        SELECTCOLUMNS (
                            'Date',
                            "@X", CONVERT ( 'Date'[Date], DOUBLE ),
                            "@Y", CONVERT ( SELECTEDMEASURE (), DOUBLE )
                        ),
                        ALLSELECTED ( 'Date' )
                    ),
                    NOT ISBLANK ( [@X] ) && NOT ISBLANK ( [@Y] )
                )
            VAR SX =
                SUMX ( Tab, [@X] )
            VAR SY =
                SUMX ( Tab, [@Y] )
            VAR SX2 =
                SUMX ( Tab, [@X] * [@X] )
            VAR SXY =
                SUMX ( Tab, [@X] * [@Y] )
            VAR N =
                COUNTROWS ( Tab )
            VAR Denominator = N * SX2 - SX * SX
            VAR Slope =
                DIVIDE ( N * SXY - SX * SY, Denominator )
            VAR Intercept =
                DIVIDE ( SY * SX2 - SX * SXY, Denominator )
            VAR V =
                Intercept
                    + Slope * VALUES ( 'Date'[Date] )
            RETURN
                V,
        ISINSCOPE ( 'Date'[Calendar Year Month] )
            || ISINSCOPE ( 'Date'[Calendar Year Month Number] )
            || ISINSCOPE ( 'Date'[Calendar Year Month As Date] ),
            VAR Tab =
                FILTER (
                    CALCULATETABLE (
                        SELECTCOLUMNS (
                            SUMMARIZE ( 'Date', 'Date'[Calendar Year Month Number] ),
                            "@X", CONVERT ( 'Date'[Calendar Year Month Number], DOUBLE ),
                            "@Y", CONVERT ( SELECTEDMEASURE (), DOUBLE )
                        ),
                        ALLSELECTED ( 'Date' )
                    ),
                    NOT ISBLANK ( [@X] ) && NOT ISBLANK ( [@Y] )
                )
            VAR SX =
                SUMX ( Tab, [@X] )
            VAR SY =
                SUMX ( Tab, [@Y] )
            VAR SX2 =
                SUMX ( Tab, [@X] * [@X] )
            VAR SXY =
                SUMX ( Tab, [@X] * [@Y] )
            VAR N =
                COUNTROWS ( Tab )
            VAR Denominator = N * SX2 - SX * SX
            VAR Slope =
                DIVIDE ( N * SXY - SX * SY, Denominator )
            VAR Intercept =
                DIVIDE ( SY * SX2 - SX * SXY, Denominator )
            VAR V =
                Intercept
                    + Slope * VALUES ( 'Date'[Calendar Year Month Number] )
            RETURN
                V,
        ISINSCOPE ( 'Date'[Calendar Year Quarter] )
            || ISINSCOPE ( 'Date'[Calendar Year Quarter Number] )
            || ISINSCOPE ( 'Date'[Calendar Year Quarter As Date] ),
            VAR Tab =
                FILTER (
                    CALCULATETABLE (
                        SELECTCOLUMNS (
                            SUMMARIZE ( 'Date', 'Date'[Calendar Year Quarter Number] ),
                            "@X", CONVERT ( 'Date'[Calendar Year Quarter Number], DOUBLE ),
                            "@Y", CONVERT ( SELECTEDMEASURE (), DOUBLE )
                        ),
                        ALLSELECTED ( 'Date' )
                    ),
                    NOT ISBLANK ( [@X] ) && NOT ISBLANK ( [@Y] )
                )
            VAR SX =
                SUMX ( Tab, [@X] )
            VAR SY =
                SUMX ( Tab, [@Y] )
            VAR SX2 =
                SUMX ( Tab, [@X] * [@X] )
            VAR SXY =
                SUMX ( Tab, [@X] * [@Y] )
            VAR N =
                COUNTROWS ( Tab )
            VAR Denominator = N * SX2 - SX * SX
            VAR Slope =
                DIVIDE ( N * SXY - SX * SY, Denominator )
            VAR Intercept =
                DIVIDE ( SY * SX2 - SX * SXY, Denominator )
            VAR V =
                Intercept
                    + Slope * VALUES ( 'Date'[Calendar Year Quarter Number] )
            RETURN
                V,
        ISINSCOPE ( 'Date'[Calendar Year] )
            || ISINSCOPE ( 'Date'[Calendar Year Number] )
            || ISINSCOPE ( 'Date'[Calendar Year As Date] ),
            VAR Tab =
                FILTER (
                    CALCULATETABLE (
                        SELECTCOLUMNS (
                            SUMMARIZE ( 'Date', 'Date'[Calendar Year Number] ),
                            "@X", CONVERT ( 'Date'[Calendar Year Number], DOUBLE ),
                            "@Y", CONVERT ( SELECTEDMEASURE (), DOUBLE )
                        ),
                        ALLSELECTED ( 'Date' )
                    ),
                    NOT ISBLANK ( [@X] ) && NOT ISBLANK ( [@Y] )
                )
            VAR SX =
                SUMX ( Tab, [@X] )
            VAR SY =
                SUMX ( Tab, [@Y] )
            VAR SX2 =
                SUMX ( Tab, [@X] * [@X] )
            VAR SXY =
                SUMX ( Tab, [@X] * [@Y] )
            VAR N =
                COUNTROWS ( Tab )
            VAR Denominator = N * SX2 - SX * SX
            VAR Slope =
                DIVIDE ( N * SXY - SX * SY, Denominator )
            VAR Intercept =
                DIVIDE ( SY * SX2 - SX * SXY, Denominator )
            VAR V =
                Intercept
                    + Slope * VALUES ( 'Date'[Calendar Year Number] )
            RETURN
                V
    )
)
Finally I saved the modifications to the model using the Save button

And confirmed the refresh request in the Power BI user inhterface.
Even if Power BI does not support the creation of calculation groups, it fully supports them when they exist in the model, therefore the newly created Trend Line calculation group is now visible in the fields panel as a normal table with a column named “Trend” whose values are “Value” and “Trend”, as can be seen in the Data view panel
An awesome series of articles on Calculation Groups can be found o SQLBI‘s site
https://www.sqlbi.com/calculation-groups/
The sample pbix model can be downloaded from my github

Sergio, this is very helpful! Working on something similar but focusing on slope from this system. To use your above example I would want to add a table that shows the Margin by customer and then color codes the cells against the slope value. The problem is the Slope and trend values cover all the data and will not update against the customer unless a slicer is added to filter down to said customer. Do you have any suggestions to generate that?
LikeLike