In my previous post Simple Linear Regression in DAX with Calculation Groups I used Calculation Groups to avoid code duplication for the Trending Measures.
A possible alternative to avoid manually duplicated code, is by writing a program to automatically duplicate code.
Tabular Editor Advanced Scripting panel allows editing and running scripts written in c# to automatically change the model. And the editor also has the intellisense!

Tabular Editor exposes an object interface, through which the script can manipulate the model.
Debugging in Tabular Editor can be done with the Output() function, that shows the content of its parameter in a popup window.

Output() can also be used as a method, applied to the object to be shown

The generated DAX Code can also be formatted using the FormatDax() method.
Scripts can also be executed by running Tabular Editor from the command line with the -S parameter. This can become very interesting when trying to build a CI/CD environment.
I wrote a parametrized script to automatically generate the Trending measures for [Sales Amount], [Margin] and [Margin %] using both hierarchies over Year, Quarter, Month and Date of the previous post, the Calendar-Hierarchy and the Calendar-Hierarchy as Date.
The parameters are
- The name of the table containing the measures
- The name of the table containing the hierarchies.
- The list of the levels of the hierarchies, each level consisting of the list of columns for the current level.
- The list of measures for which the Trending Measure is to be generated.
string tableForMeasures = "Sales";

// Table to be uses for the Hierarchy
string hierarchyTable = "Date";

// Hierarchy levels from higher to lower granularity
// each level contains the list of the columns to be
// considered for the ISINSCOPE condition
// the first one is used as X value for the calculation
// and must be of numeric type
List<string> level1 = new List<string> { "Date" };
List<string> level2 = new List<string> {
    "Calendar Year Month Number",
    "Calendar Year Month",
    "Calendar Year Month As Date" };
List<string> level3 = new List<string> {
    "Calendar Year Quarter Number",
    "Calendar Year Quarter",
    "Calendar Year Quarter As Date" };
List<string> level4 = new List<string> {
    "Calendar Year Number",
    "Calendar Year",
    "Calendar Year As Date" };

List<List<string>> levels = new List<List<string>> {
    level1, level2, level3, level4};


// the measures for which the Trend measure is to be generated
List<string> measures = new List<string> {
    "Margin", "Margin %", "Sales Amount" };
Running the script, I generated the measures [Sales Amount Trend], [Margin Trend] and [Margin % Trend]

That can be used as usual, like in the previous posts

Conclusions
Scripting for generating DAX code is a powerful tool, to be considered when many similar measures are to be written. The simple interface makes writing scripts easier than expected.
In the maintenance phase, scripts will allow quick modification of group of measures to be done in a snap.
The script
As a first step to create the script, we must run Tabular Editor from the Power BI External Tool Ribbon
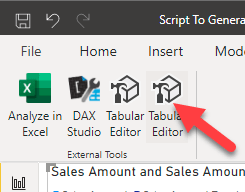
this opens Tabular Editor, automatically connected to Power BI
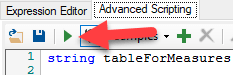
Then we must select the Advanced Scripting panel and we can start writing the code.

The green arrow in the toolbar runs the script
To write the code I started from the [Margin Trend on Hierarchy] measure of my original post Simple Linear Regression in DAX with Hierarchy on Date Table:
Margin Trend on Hierarchy =
IF (
    NOT ISBLANK ( [Margin] ),
    SWITCH (
        TRUE,
        ISINSCOPE ( 'Date'[Date] ),
            VAR Tab =
                FILTER (
                    CALCULATETABLE (
                        SELECTCOLUMNS (
                            'Date',
                            "@X", CONVERT ( 'Date'[Date], DOUBLE ),
                            "@Y", CONVERT ( [Margin], DOUBLE )
                        ),
                        ALLSELECTED ( 'Date' )
                    ),
                    NOT ISBLANK ( [@X] ) && NOT ISBLANK ( [@Y] )
                )
            VAR SX =
                SUMX ( Tab, [@X] )
            VAR SY =
                SUMX ( Tab, [@Y] )
            VAR SX2 =
                SUMX ( Tab, [@X] * [@X] )
            VAR SXY =
                SUMX ( Tab, [@X] * [@Y] )
            VAR N =
                COUNTROWS ( Tab )
            VAR Denominator = N * SX2 - SX * SX
            VAR Slope =
                DIVIDE ( N * SXY - SX * SY, Denominator )
            VAR Intercept =
                DIVIDE ( SY * SX2 - SX * SXY, Denominator )
            VAR V =
                Intercept
                    + Slope * VALUES ( 'Date'[Date] )
            RETURN
                V,
        ISINSCOPE ( 'Date'[Calendar Year Month] )
            || ISINSCOPE ( 'Date'[Calendar Year Month Number] )
            || ISINSCOPE ( 'Date'[Calendar Year Month As Date] ),
            VAR Tab =
                FILTER (
                    CALCULATETABLE (
                        SELECTCOLUMNS (
                            SUMMARIZE ( 'Date', 'Date'[Calendar Year Month Number] ),
                            "@X", CONVERT ( 'Date'[Calendar Year Month Number], DOUBLE ),
                            "@Y", CONVERT ( [Margin], DOUBLE )
                        ),
                        ALLSELECTED ( 'Date' )
                    ),
                    NOT ISBLANK ( [@X] ) && NOT ISBLANK ( [@Y] )
                )
            VAR SX =
                SUMX ( Tab, [@X] )
            VAR SY =
                SUMX ( Tab, [@Y] )
            VAR SX2 =
                SUMX ( Tab, [@X] * [@X] )
            VAR SXY =
                SUMX ( Tab, [@X] * [@Y] )
            VAR N =
                COUNTROWS ( Tab )
            VAR Denominator = N * SX2 - SX * SX
            VAR Slope =
                DIVIDE ( N * SXY - SX * SY, Denominator )
            VAR Intercept =
                DIVIDE ( SY * SX2 - SX * SXY, Denominator )
            VAR V =
                Intercept
                    + Slope * VALUES ( 'Date'[Calendar Year Month Number] )
            RETURN
                V,
        ISINSCOPE ( 'Date'[Calendar Year Quarter] )
            || ISINSCOPE ( 'Date'[Calendar Year Quarter Number] )
            || ISINSCOPE ( 'Date'[Calendar Year Quarter As Date] ),
            VAR Tab =
                FILTER (
                    CALCULATETABLE (
                        SELECTCOLUMNS (
                            SUMMARIZE ( 'Date', 'Date'[Calendar Year Quarter Number] ),
                            "@X", CONVERT('Date'[Calendar Year Quarter Number], DOUBLE),
                            "@Y", CONVERT([Margin], DOUBLE)
                        ),
                        ALLSELECTED ( 'Date' )
                    ),
                    NOT ISBLANK ( [@X] ) && NOT ISBLANK ( [@Y] )
                )
            VAR SX =
                SUMX ( Tab, [@X] )
            VAR SY =
                SUMX ( Tab, [@Y] )
            VAR SX2 =
                SUMX ( Tab, [@X] * [@X] )
            VAR SXY =
                SUMX ( Tab, [@X] * [@Y] )
            VAR N =
                COUNTROWS ( Tab )
            VAR Denominator = N * SX2 - SX * SX
            VAR Slope =
                DIVIDE ( N * SXY - SX * SY, Denominator )
            VAR Intercept =
                DIVIDE ( SY * SX2 - SX * SXY, Denominator )
            VAR V =
                Intercept
                    + Slope * VALUES ( 'Date'[Calendar Year Quarter Number] )
            RETURN
                V,
        ISINSCOPE ( 'Date'[Calendar Year] )
            || ISINSCOPE ( 'Date'[Calendar Year Number] )
            || ISINSCOPE ( 'Date'[Calendar Year As Date] ),
            VAR Tab =
                FILTER (
                    CALCULATETABLE (
                        SELECTCOLUMNS (
                            SUMMARIZE ( 'Date', 'Date'[Calendar Year Number] ),
                            "@X", CONVERT('Date'[Calendar Year Number], DOUBLE),
                            "@Y", CONVERT([Margin], DOUBLE)
                        ),
                        ALLSELECTED ( 'Date' )
                    ),
                    NOT ISBLANK ( [@X] ) && NOT ISBLANK ( [@Y] )
                )
            VAR SX =
                SUMX ( Tab, [@X] )
            VAR SY =
                SUMX ( Tab, [@Y] )
            VAR SX2 =
                SUMX ( Tab, [@X] * [@X] )
            VAR SXY =
                SUMX ( Tab, [@X] * [@Y] )
            VAR N =
                COUNTROWS ( Tab )
            VAR Denominator = N * SX2 - SX * SX
            VAR Slope =
                DIVIDE ( N * SXY - SX * SY, Denominator )
            VAR Intercept =
                DIVIDE ( SY * SX2 - SX * SXY, Denominator )
            VAR V =
                Intercept
                    + Slope * VALUES ( 'Date'[Calendar Year Number] )
            RETURN
                V
    )
)
The Trending measure consists of a template that repeats itself several times, with little changes for each level of the hierarchy. Therefore it’s possible to leverage the similarities to shorten the code to be written, and also to parametrize the number of levels of the hierarchy for which the measures must be generated.
The first bit is the initial IF with the SWITCH, that contains that “lasagna” of code corresponding to the different levels of the hierarchy.
IF (
    NOT ISBLANK ( [Margin] ),
    SWITCH (
        TRUE,
... lasagna ...
    )
)
Then, the “lasagna” consists of a repetition of the code in the form of
ISINSCOPE ( 'Date'[Calendar Year Quarter] )
    || ISINSCOPE ( 'Date'[Calendar Year Quarter Number] )
    || ISINSCOPE ( 'Date'[Calendar Year Quarter As Date] ),
    VAR Tab =
        FILTER (
            CALCULATETABLE (
                SELECTCOLUMNS (
                    SUMMARIZE ( 'Date',
                                'Date'[Calendar Year Quarter Number] ),
                    "@X", CONVERT('Date'[Calendar Year Quarter Number],
                                   DOUBLE),
                    "@Y", CONVERT([Margin], DOUBLE)
                ),
                ALLSELECTED ( 'Date' )
            ),
            NOT ISBLANK ( [@X] ) && NOT ISBLANK ( [@Y] )
        )
    VAR SX =
        SUMX ( Tab, [@X] )
    VAR SY =
        SUMX ( Tab, [@Y] )
    VAR SX2 =
        SUMX ( Tab, [@X] * [@X] )
    VAR SXY =
        SUMX ( Tab, [@X] * [@Y] )
    VAR N =
        COUNTROWS ( Tab )
    VAR Denominator = N * SX2 - SX * SX
    VAR Slope =
        DIVIDE ( N * SXY - SX * SY, Denominator )
    VAR Intercept =
        DIVIDE ( SY * SX2 - SX * SXY, Denominator )
    VAR V =
        Intercept
            + Slope * VALUES ( 'Date'[Calendar Year Quarter Number] )
    RETURN
        V,
In the first part there is the condition to be checked to select this layer of “lasagna”. This condition must become a parameter be generated by calling ISINSCOPE() on the corresponding columns in the hierarchies.
In the code that calculates the Simple Linear Regression the parameters are
- ‘Date’: The table
- ‘Date'[Calendar Year Quarter Number]: the numeric column to be used for the X axis
- [Margin]: The measure
So we can transform this snippet of code to the corresponding template, where the placeholderrs for the parametes are reprensented by integer numbers wrapped into curly braces, ready to be used as the format string for the string.Format() method of c#.
string trendMeasureHierarchyLevelFormat = @"
{0},
    VAR Tab =
        FILTER (
            CALCULATETABLE (
                SELECTCOLUMNS (
                    SUMMARIZE ( {1}, {2} ),
                    ""@X"", CONVERT ( {2}, DOUBLE ),
                    ""@Y"", CONVERT ( {3}, DOUBLE )
                ),
                ALLSELECTED ( {1} )
            ),
            NOT ISBLANK ( [@X] ) && NOT ISBLANK ( [@Y] )
        )
    VAR SX =
        SUMX ( Tab, [@X] )
    VAR SY =
        SUMX ( Tab, [@Y] )
    VAR SX2 =
        SUMX ( Tab, [@X] * [@X] )
    VAR SXY =
        SUMX ( Tab, [@X] * [@Y] )
    VAR N =
        COUNTROWS ( Tab )
    VAR Denominator = N * SX2 - SX * SX
    VAR Slope =
        DIVIDE ( N * SXY - SX * SY, Denominator )
    VAR Intercept =
        DIVIDE ( SY * SX2 - SX * SXY, Denominator )
    VAR V =
        Intercept
            + Slope * VALUES ( {2} )
    RETURN
        V";
After a few lines of standard c# code we obtain a string containing the measure and we can use the object model interface to access the Measures collection of the table where the measure is to be created. This is the code that checks if the measure exists in the model, creates it if needed and then assigns it the new DAX expression.
// retrieve the object to define the measures to
var table  = Model.Tables[tableForMeasures];
var tableMeasures = table.Measures;

...

    // checks if the measure exists, if not, creates it
    if (!tableMeasures.Contains(trendMeasureName))
    {
        table.AddMeasure(trendMeasureName);
    }
    tableMeasures[trendMeasureName].Expression = trendMeasureDax;
At last we call the FormatDax() method on the whole collection to format all the measures.
We must use the method that formats the collection instead of the single measures because formatting uses the DaxFormatter web service. This means that we send only one call to the web service instead of one call per measure.
Here is the final script
string tableForMeasures = "Sales";

// Table to be uses for the Hierarchy
string hierarchyTable = "Date";

// Hierarchy levels from higher to lower granularity
// each level contains the list of the columns to be
// considered for the ISINSCOPE condition
// the first one is used as X value for the calculation
// and must be of numeric type
List<string> level1 = new List<string> { "Date" };
List<string> level2 = new List<string> {
    "Calendar Year Month Number",
    "Calendar Year Month",
    "Calendar Year Month As Date" };
List<string> level3 = new List<string> {
    "Calendar Year Quarter Number",
    "Calendar Year Quarter",
    "Calendar Year Quarter As Date" };
List<string> level4 = new List<string> {
    "Calendar Year Number",
    "Calendar Year",
    "Calendar Year As Date" };

List<List<string>> levels = new List<List<string>> {
    level1, level2, level3, level4};


// the measures for which the Trend measure is to be generated
List<string> measures = new List<string> {
    "Margin", "Margin %", "Sales Amount" };

string trendMeasureBaseFormat = @"
IF (
    NOT ISBLANK ( {0} ),
    SWITCH (
        TRUE,
        {1}
    )
)";


string trendMeasureHierarchyLevelFormat = @"
{0},
    VAR Tab =
        FILTER (
            CALCULATETABLE (
                SELECTCOLUMNS (
                    SUMMARIZE ( {1}, {2} ),
                    ""@X"", CONVERT ( {2}, DOUBLE ),
                    ""@Y"", CONVERT ( {3}, DOUBLE )
                ),
                ALLSELECTED ( {1} )
            ),
            NOT ISBLANK ( [@X] ) && NOT ISBLANK ( [@Y] )
        )
    VAR SX =
        SUMX ( Tab, [@X] )
    VAR SY =
        SUMX ( Tab, [@Y] )
    VAR SX2 =
        SUMX ( Tab, [@X] * [@X] )
    VAR SXY =
        SUMX ( Tab, [@X] * [@Y] )
    VAR N =
        COUNTROWS ( Tab )
    VAR Denominator = N * SX2 - SX * SX
    VAR Slope =
        DIVIDE ( N * SXY - SX * SY, Denominator )
    VAR Intercept =
        DIVIDE ( SY * SX2 - SX * SXY, Denominator )
    VAR V =
        Intercept
            + Slope * VALUES ( {2} )
    RETURN
        V";


// retrieve the object to define the measures to
var table  = Model.Tables[tableForMeasures];
var tableMeasures = table.Measures;

// iterating over the measure to be generated
foreach(string measureName in measures)
{
    string trendMeasureName = measureName + " Trend";
    string measure = string.Format("[{0}]", measureName);

    // generating the body of the trend measure: the levels of the hierarchy
    string body = "";
    for (int indexLevel = 0; indexLevel < levels.Count; ++indexLevel)
    {
        List<string> columns = levels[indexLevel];
        // generating the condition
        string xAxisColumn = string.Format(
            "'{0}'[{1}]", hierarchyTable, columns[0] );
        string condition = string.Format(
            "ISINSCOPE({0})", xAxisColumn);
        for (int indexColumn = 1;
             indexColumn < columns.Count;
             ++indexColumn)
        {
            string column = string.Format(
                "'{0}'[{1}]", hierarchyTable,
                columns[indexColumn] );
            string conditionToAppend = string.Format(
                " || ISINSCOPE({0})", column);
            condition += conditionToAppend;
        }
        string bodyLevel = string.Format(
            trendMeasureHierarchyLevelFormat,
            condition, hierarchyTable, xAxisColumn, measure );
        body += bodyLevel;
        if (indexLevel + 1 < levels.Count)
        {
            body += ",\n";
        }
    }

    // put the body into the trend measure base
    string trendMeasureDax = string.Format(
        trendMeasureBaseFormat, measure, body );

    // checks if the measure exists, if not, creates it
    if (!tableMeasures.Contains(trendMeasureName))
    {
        table.AddMeasure(trendMeasureName);
    }
    tableMeasures[trendMeasureName].Expression = trendMeasureDax;

}

// Format all the measures of the table using DaxFormatter.com
tableMeasures.FormatDax(false);
References
- Tabular Editor Advanced Scripting
- Tabular Editor Command Line Options
- Tabular Editor 2
- Tabular Editor 3
The sample pbix and the script can be downloaded from my github page
